

Your Menu Is Not a Price List: The New Economics of Restaurant Menu Engineering
Why the most profitable restaurant menus are engineered around choice, contribution and customer tolerance
By Robert Ancill, Chairman, TNI Restaurant Consultants
A few years ago, I sat with a restaurant operator who was convinced that one of his best-selling dishes was also one of his most profitable. It had a respectable food-cost percentage, guests loved it, servers recommended it and removing it would have been unthinkable. On paper, everything looked right. When we separated percentage from contribution dollars, however, the story changed. The dish was consuming expensive ingredients, significant preparation time and valuable menu attention while producing considerably less contribution than several items selling around it. The restaurant did not have a food-cost problem. It had a choice architecture problem.
This distinction sits at the center of modern menu engineering. Restaurants have traditionally viewed the menu as a list of products accompanied by prices. I believe that description is now inadequate. A menu is a commercial decision system. It determines what customers notice, what they compare, what they perceive as expensive, what feels safe, what feels indulgent and, ultimately, where thousands of individual purchasing decisions accumulate on the restaurant’s P&L.
That makes menu engineering one of the most underestimated disciplines in restaurant economics. The objective is not simply to calculate food cost, increase prices or make the menu visually attractive. It is to understand the relationship between what customers choose and what those choices contribute financially to the business.
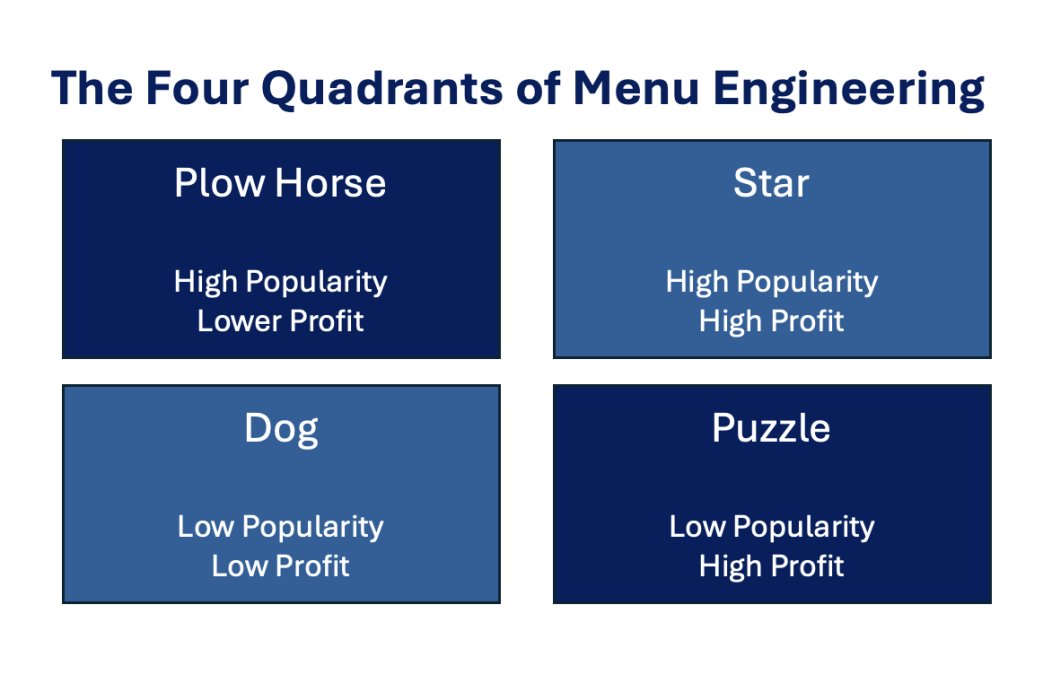
The classic menu-engineering model remains useful because it compares two fundamental variables: popularity and contribution margin, producing the familiar Stars, Plowhorses, Puzzles and Dogs matrix. The underlying mathematics remains remarkably powerful. But restaurants in 2026 operate in a much more complicated environment than the original framework contemplated. Digital ordering, delivery commissions, ingredient volatility, labor pressure, GLP-1-driven consumption changes, daypart fragmentation and increasing price sensitivity mean that a modern menu needs to understand much more than popularity and plate cost.
The menu has become the intersection between restaurant economics and consumer psychology.
The Number That Can Mislead an Entire Restaurant
Ask ten restaurant operators how they measure menu profitability and most will eventually mention food-cost percentage. There is nothing wrong with food-cost percentage. The problem begins when it becomes the primary decision metric.
Consider two dishes.
|
Item |
Plate Cost |
Selling Price |
Food Cost % |
Contribution Margin |
|---|---|---|---|---|
|
Dish A |
$4.20 |
$14.00 |
30% |
$9.80 |
|
Dish B |
$9.80 |
$28.00 |
35% |
$18.20 |
If management is obsessed with percentage, Dish A looks superior. It operates at 30 percent food cost compared with 35 percent for Dish B. Yet Dish B contributes $18.20 toward labor, occupancy, utilities, insurance, marketing and profit every time it sells, compared with only $9.80 from Dish A. The supposedly “worse” item generates almost twice the contribution dollars per transaction. This example comes directly from the menu-engineering analysis underlying this article.
That leads to a principle I have repeated throughout my career: percentages measure efficiency; dollars pay the rent.
Neither measure should be ignored. Food-cost percentage tells us something important about ingredient efficiency, while contribution margin tells us how much economic oxygen the transaction actually leaves behind. Menu engineering begins when those numbers are connected to volume.
The basic equation is beautifully simple:
Contribution Margin = Selling Price − Plate Cost
The next equation is even more important:
Total Item Contribution = Contribution Margin × Units Sold
Suddenly we are no longer discussing recipes. We are discussing economics.
The Four Boxes Still Matter
The classic menu-engineering matrix remains one of the industry’s most useful analytical tools because it forces every menu item into a conversation about both popularity and profitability.
|
Classification |
Popularity |
Contribution |
Strategic Question |
|---|---|---|---|
|
Star |
High |
High |
How do we protect and amplify it? |
|
Plowhorse |
High |
Low |
How do we improve its economics without damaging demand? |
|
Puzzle |
Low |
High |
Why aren’t more people choosing it? |
|
Dog |
Low |
Low |
What strategic reason justifies keeping it? |
A Star deserves protection because customers already choose it and the economics work. The danger is unnecessary intervention. Operators sometimes increase the price of a Star simply because they believe its popularity proves unlimited pricing power. That can be remarkably shortsighted.
A Plowhorse presents a different challenge. Customers love it, but its economics are weak. The first question should rarely be, “How much can we increase the price?” Instead, examine portion size, ingredient specification, garnish, preparation, purchasing, waste and potential add-ons. The objective is to improve contribution without destroying the reason customers choose it.
A Puzzle can be even more interesting. The economics work but demand does not. Perhaps its menu position is poor. Perhaps the description fails. Perhaps the photograph is unappealing, the name is confusing, servers do not recommend it or the customer cannot understand why it costs what it costs. The product may not need changing at all; the decision environment around the product may need changing.
Then there is the Dog. Low popularity and low contribution normally suggest deletion, yet even here context matters. A children’s item, vegan dish or allergy-sensitive option may perform a strategic role greater than its direct contribution. Removing it could cost an entire party rather than one entrée. Menu engineering therefore requires judgment as well as mathematics.
The Menu Has an Invisible P&L
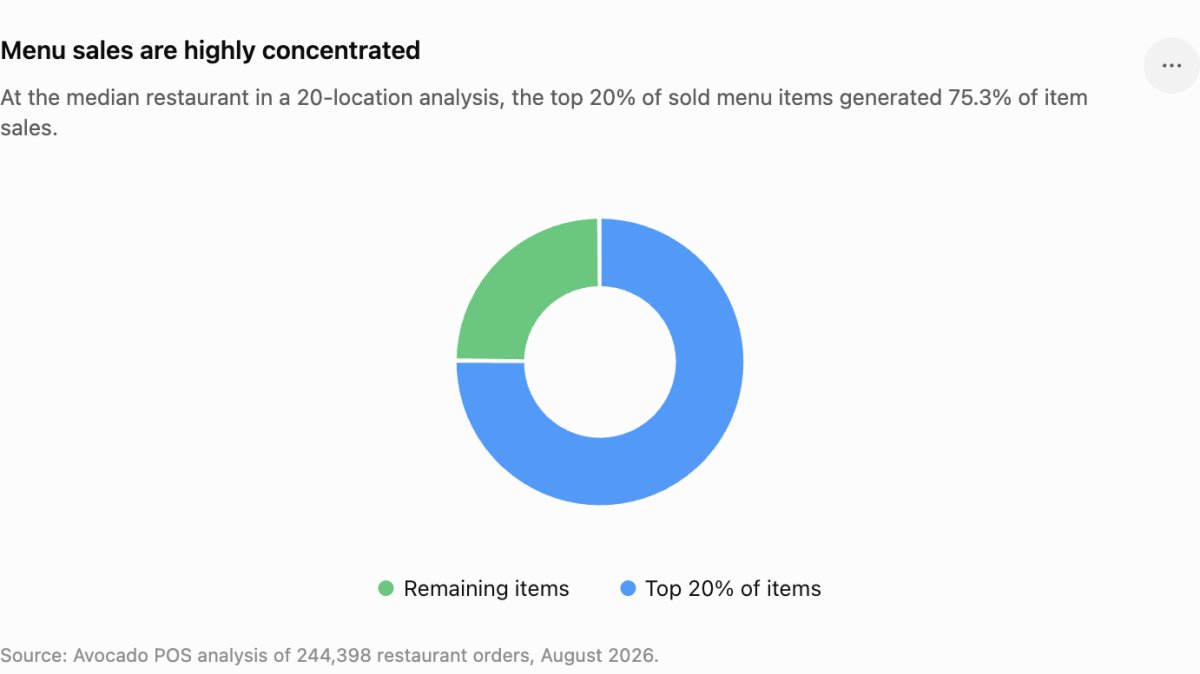
One of the most interesting datasets published this year analyzed 244,398 restaurant orders across 20 high-volume locations. At the median restaurant, the top 20 percent of items generated 75.3 percent of item sales, while approximately 28.1 percent of items were required to generate 80 percent of sales.
The precise percentage will vary enormously between concepts, but the strategic message matters: restaurant demand is concentrated.
That raises an uncomfortable question. If a relatively small proportion of the menu produces most customer decisions, what is the rest of the menu doing?
Some items provide variety. Some satisfy dietary requirements. Some establish price anchors. Some create brand credibility. Others, however, simply generate purchasing complexity, inventory, preparation, waste, training requirements and decision fatigue.
This is why I increasingly think about Menu Productivity rather than menu size. The objective is not automatically to make a menu smaller. It is to ensure that every item earns the complexity it creates.
An item occupying one line on a menu may require three unique ingredients, refrigerator space, prep time, training, recipe documentation, POS programming, allergen controls and purchasing administration. Its true economic footprint is therefore substantially larger than its food cost.
The menu has an invisible P&L, and most restaurants never calculate it.
From Menu Engineering to Choice Engineering
Traditional menu engineering asks two questions: how profitable is the item and how popular is it?
Modern menu engineering should ask a third: why was it chosen?
This is where consumer psychology becomes commercially important. Price anchoring, menu position, descriptive language, visual hierarchy and choice architecture can alter what customers perceive before they have consciously compared the numbers. Your existing analysis correctly makes the point that psychological pricing should amplify sound economics rather than rescue bad economics.
A $42 premium steak, for example, can alter the perceived affordability of a $29 entrée sitting near it. A carefully described dish can communicate craftsmanship and ingredient quality that a generic name cannot. A premium item can establish an anchor even when it never becomes the category’s volume leader.
This creates what I call the Menu Choice Gap: the distance between the item the restaurant wants the customer to choose and the item the customer actually chooses.
Closing that gap can sometimes generate more profit than increasing prices.
The Zone of Purchase Acceptance
Price itself also needs to be understood differently. Cost-plus pricing is useful because it establishes an economic floor, but it cannot tell us what a customer believes an item is worth. Your existing analysis makes this distinction particularly well: cost determines the minimum sustainable price, while willingness to pay establishes the ceiling.
At TNI, we think about this through the Zone of Purchase Acceptance, or ZOPA. For any menu item, there is a range within which price feels credible. Below that zone, the restaurant may unnecessarily surrender margin or even communicate lower quality. Above it, the customer begins to question value, substitute another item or abandon the purchase.
The optimal menu price therefore does not necessarily sit at the lowest possible food-cost percentage. It sits at the point where contribution and purchase acceptance are optimized together.
This becomes especially important after several years of restaurant inflation. Customers now carry stronger internal reference prices. They may not know what your salmon costs, but they possess a remarkably intuitive sense of what lunch, a burger, a cocktail or dinner for two “should” cost.
Cross that tolerance threshold and the customer does not always complain. Often, they simply stop coming.
That is one of the most dangerous forms of restaurant feedback because silence can look remarkably similar to satisfaction until the traffic report arrives.
A Worked Example: When the “Bad” Food Cost Wins
Imagine a restaurant sells 400 units of Dish A and 250 units of Dish B each month.
|
Item |
Contribution Per Sale |
Monthly Units |
Monthly Contribution |
|---|---|---|---|
|
Dish A |
$9.80 |
400 |
$3,920 |
|
Dish B |
$18.20 |
250 |
$4,550 |
Dish B sells 37.5 percent fewer units, yet generates $630 more monthly contribution. Annualized, that difference becomes $7,560.
Now imagine a restaurant has 40 entrées, appetizers, desserts and sides producing similar hidden differences. This is where menu engineering stops being an academic exercise and becomes EBITDA strategy.
The lesson is not that expensive dishes are always better. It is that volume without contribution can create the illusion of success, while percentage without volume can create the illusion of efficiency. Restaurants need both.
The New Metric: Contribution per Cover
I would take the analysis one step further and measure contribution margin per cover.
If 100 guests entered yesterday, how much menu contribution did those 100 purchasing decisions generate?
This gives operators a powerful way to determine whether menu changes are genuinely improving economics. Raising prices might increase contribution per item while reducing attachments. Removing an appetizer could simplify operations but reduce overall contribution per cover. A new premium beverage may have modest volume yet materially improve total transaction economics.
The menu should therefore be analyzed as an ecosystem rather than a collection of independent dishes.
A burger can influence fries. Steak can influence wine. Cocktails can influence appetizers. Entrée portion size can influence dessert. Bundles can change perceived value. A high-priced anchor can alter the apparent affordability of everything around it.
The customer buys a meal. Too often, the restaurant analyzes components.
Digital Menus Changed the Laboratory
Digital menus create an opportunity that printed menus never could: experimentation at speed.
A printed menu becomes outdated almost as soon as it leaves the printer. Digital menu boards, online ordering platforms and QR menus can change by location, channel and daypart. More importantly, they can create measurable experiments.
Your existing article correctly argues that QR menus should be treated as a data channel rather than simply a PDF accessed through a square barcode.
That distinction is enormous.
A digital menu can potentially tell us what customers saw, what they selected, what they ignored and, depending upon the platform, where they abandoned the journey. Multi-unit operators can test different descriptions, positions, bundles or prices across comparable stores and observe whether contribution improves.
That turns the menu into a laboratory.
The important discipline is control. Change one meaningful variable, measure the result and avoid confusing correlation with causation. A price test conducted simultaneously with a new photograph, new description and promotion tells management almost nothing about which intervention worked.
Dynamic Pricing Needs a Tolerance Index
Dynamic pricing deserves particular caution. Restaurants have watched airlines, hotels and ride-share platforms vary prices according to demand and understandably wondered whether the same economics can apply to foodservice.
Technically, they can.
Psychologically, the answer is more complicated.
Customers readily understand happy hour, early-bird pricing, lunch specials and market-priced seafood because there is an understandable reason for the difference. An unexplained burger that becomes more expensive at 7:00 p.m. can feel very different.
The question is therefore not simply whether technology allows dynamic pricing. The question is whether the customer considers the reason legitimate.
This is where Tolerance Index thinking becomes valuable. Price flexibility should be measured against value clarity, time certainty, flow integrity and customer expectation. The operator may possess the technical capability to change a price every fifteen minutes, but technological capability is not the same as customer permission.
The smartest dynamic pricing may consequently look less like surge pricing and more like intelligent occasion pricing: happy hour, weekday bundles, late-night menus, early dining, limited inventory specials and channel-specific offers.
GLP-1 Will Force Menu Engineering to Evolve Again
There is another emerging issue traditional menu engineering was never designed to solve: customers deliberately consuming less.
As GLP-1 adoption expands, restaurants face the possibility that some customers will continue dining out while ordering smaller quantities, fewer courses and less alcohol. This changes the economic architecture of the meal.
The instinctive response is smaller portions. The better response may be higher value density.
A smaller plate can carry better ingredients. A half portion can preserve choice without feeling punitive. Protein-forward dishes can command relevance. Smaller desserts can protect attachment. Sophisticated zero-proof drinks can recover some beverage economics.
Menu engineering therefore needs to move beyond asking, “How much does this dish cost?” and begin asking, “How much contribution can this occasion support?”
The Server Is Part of the Menu
One of the most common failures occurs after all the analysis is complete. Management engineers the menu, identifies Puzzles and Stars, changes descriptions, adjusts prices and then forgets to tell the people standing at the table.
Servers are part of menu architecture.
Your underlying article describes them as the “last mile” of menu engineering, which is exactly right. A server who knows which dishes require explanation can move a Puzzle. A bartender who understands beverage contribution can improve attachment without sounding like an upseller. A server who can explain why a premium dish is worth the price can expand the customer’s Zone of Purchase Acceptance.
This should be trained through language rather than instructions to “sell more.” Give employees natural descriptions, tasting knowledge and genuine reasons to recommend particular dishes.
Great menu engineering should feel invisible to the customer.
The Restaurant Menu Engineering Dashboard
A modern restaurant should monitor more than food cost.
|
Metric |
What It Tells You |
|---|---|
|
Food Cost % |
Ingredient efficiency |
|
Contribution Margin |
Dollars generated per item |
|
Units Sold |
Popularity |
|
Total Item Contribution |
Economic importance |
|
Contribution per Cover |
Quality of overall sales mix |
|
Modifier Attachment |
Add-on opportunity |
|
Beverage Attachment |
Check architecture |
|
Waste |
Hidden menu cost |
|
Prep Complexity |
Operational burden |
|
Daypart Mix |
When demand exists |
|
Channel Mix |
Where the item is purchased |
|
Price Elasticity |
Customer tolerance |
|
Repeat Purchase |
Long-term item relevance |
No single metric answers the whole question. The strength comes from connecting them.
Menu Engineering Is Really Relevance Engineering
The most important conclusion is that menu engineering should not be treated as an annual exercise performed when food cost becomes uncomfortable.
It is continuous commercial management.
Ingredient prices change. Customer reference prices change. competitors change. Delivery economics change. Dietary behavior changes. Portions drift. Recipes drift. Staff behavior changes. A Star can become a Plowhorse, a Puzzle can become a Star and yesterday’s sacred signature item can become tomorrow’s operational Dog.
The original Stars, Plowhorses, Puzzles and Dogs framework gives restaurants an excellent map. Modern restaurant strategy needs to add another layer: choice, tolerance, friction, occasion and relevance.
Because the most profitable dish on a spreadsheet has no value if nobody chooses it, while the most popular dish in the restaurant has surprisingly little value if it contributes insufficient dollars to sustain the business.
The real objective of menu engineering is therefore not to manipulate customers into spending more. It is to create a menu where what the customer wants to buy and what the restaurant needs to sell increasingly become the same thing.
That is when the menu stops being a price list and starts becoming strategy.
Frequently Asked Questions
What is restaurant menu engineering?
Restaurant menu engineering is the systematic analysis of menu items using profitability and popularity to determine which dishes should be protected, promoted, repositioned, repriced, re-engineered or removed. The classic framework categorizes items as Stars, Plowhorses, Puzzles and Dogs. Modern menu engineering should additionally consider customer willingness to pay, operational complexity, daypart, channel economics and overall contribution per cover. Also found here: https://tnirestaurantconsultants.com/menu-engineering/
What is the difference between menu engineering and menu design?
Menu engineering determines what the restaurant should sell, at what price and with what commercial priority. Menu design determines how those decisions are visually communicated through typography, placement, descriptions, imagery and hierarchy. A beautifully designed menu built on poor economics simply makes the wrong products easier to buy.
How is contribution margin calculated?
Contribution margin is calculated by subtracting the plate cost from the selling price. A dish selling for $18 with a plate cost of $5.40 therefore produces a $12.60 contribution margin before labor, occupancy and other operating expenses.
Why isn't food-cost percentage enough?
Food-cost percentage measures ingredient cost relative to selling price but does not tell you how many contribution dollars the item generates. A higher-priced dish can carry a higher food-cost percentage while still contributing substantially more dollars toward payroll, rent and profit.
What are Stars in menu engineering?
Stars combine high popularity with high contribution margin. They are the strongest items on the menu and should generally be protected, made visible and monitored carefully before significant recipe or pricing changes are made.
What are Plowhorses?
Plowhorses are highly popular but generate relatively low contribution. Rather than automatically increasing their prices, operators should examine portion size, purchasing, ingredient specifications, waste, add-ons and preparation before risking the demand that makes the item valuable.
What is a Puzzle?
A Puzzle generates attractive contribution but insufficient sales. The question is therefore why customers are not choosing it. Menu position, naming, description, imagery, server recommendation, perceived value and unfamiliar ingredients should all be investigated.
Should restaurants remove every Dog?
No. A low-volume, low-margin item may serve a strategic purpose, such as satisfying dietary requirements or allowing a group with different needs to choose the restaurant. Dogs should be challenged rather than automatically deleted.
How often should restaurants conduct menu engineering?
A comprehensive review is generally sensible quarterly, while plate costs should be monitored much more frequently where ingredient prices are volatile. The underlying article recommends monthly costing checks because outdated invoice pricing can distort every subsequent decision.
What is psychological menu pricing?
Psychological menu pricing uses framing, anchors, descriptions, price presentation and choice architecture to influence perceived value. These techniques work best when the underlying pricing is commercially sound; psychology can amplify good economics but should not be expected to rescue bad economics.
What is price anchoring on a restaurant menu?
Price anchoring introduces a credible premium reference point against which other prices are interpreted. A premium steak, bottle of wine or signature experience can make nearby choices appear comparatively accessible, provided the anchor itself represents genuine value.
Can digital menus improve profitability?
Yes, particularly because digital menus allow restaurants to test pricing, descriptions, placement, dayparts and offers without repeatedly printing menus. For multi-unit operators, controlled location tests can make menu engineering a continuous measurement process rather than an occasional redesign exercise.
Should restaurants use dynamic pricing?
Selective dynamic pricing can work when the reason is understandable to the customer. Happy hour, weekday promotions and time-specific menus are familiar examples. Arbitrary price changes during busy periods carry greater risk because customers may interpret them as unfair rather than valuable.
How does GLP-1 affect restaurant menu engineering?
GLP-1 usage may change portion demand, course attachment, alcohol consumption and overall check composition. Restaurants should monitor actual customer behavior and consider smaller portions, protein-forward dishes, higher-value ingredients, zero-proof beverages and other ways of increasing value density rather than simply relying on abundance.
What is the biggest menu-engineering mistake restaurants make?
The biggest mistake is treating menu engineering as a pricing exercise rather than a customer-choice exercise. Increasing every price by the same percentage may improve theoretical margins while damaging sales mix and traffic. Effective menu engineering analyzes each item individually and then considers how all those items work together to shape the customer's total purchase.